Metrics & response rates
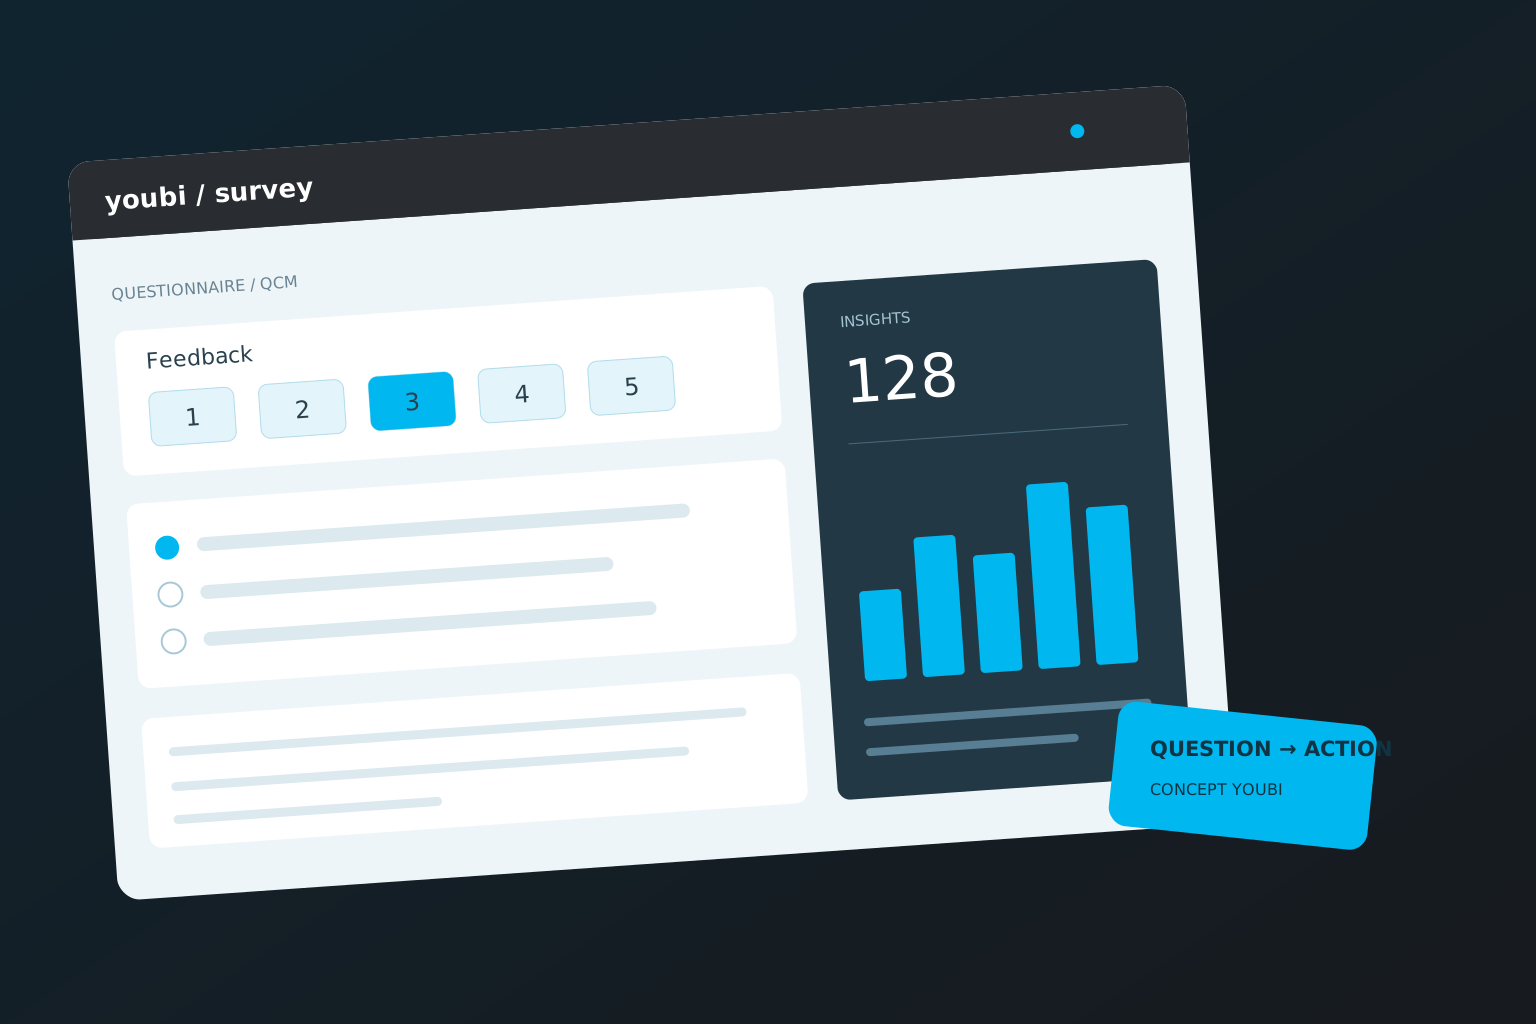
Separate invitations, participation and completed responses.

 Your business. Your logic. Your tool. ↗
 Ask the right questions. Put answers to work. ↗
 A presence that sets you apart. ↗
 Your expertise, brought to life. ↗Solutions for your reality. ↗WORLD ILLUSTRATION · YOUBI CONCEPT
Raw responses alone are not enough. Filters, calculations, comparisons and exports are organised around the decisions your team needs to make.
We start with your content and operations to define a useful response. Designs are validated with you in stages before delivering the agreed scope.
Possibilities selected and specified during scoping.
Separate invitations, participation and completed responses.
Explore results by period, location or permitted population.
Compare using documented calculation rules.
Restrict distribution of reports and detailed responses.
The proposal specifies formats, scope, approval stages and revision terms.
Your business, audiences, content and constraints.
A visual direction and journeys to validate together.
Tangible versions to try, correct and refine.
Agreed files, access and support.
We assess useful identifiers, consent, permissions and available interfaces. Anonymous surveys must not be linked to named records by default.
Volume, available content, features and delivery constraints determine the tailored proposal. We define essentials and options together.